Infographics


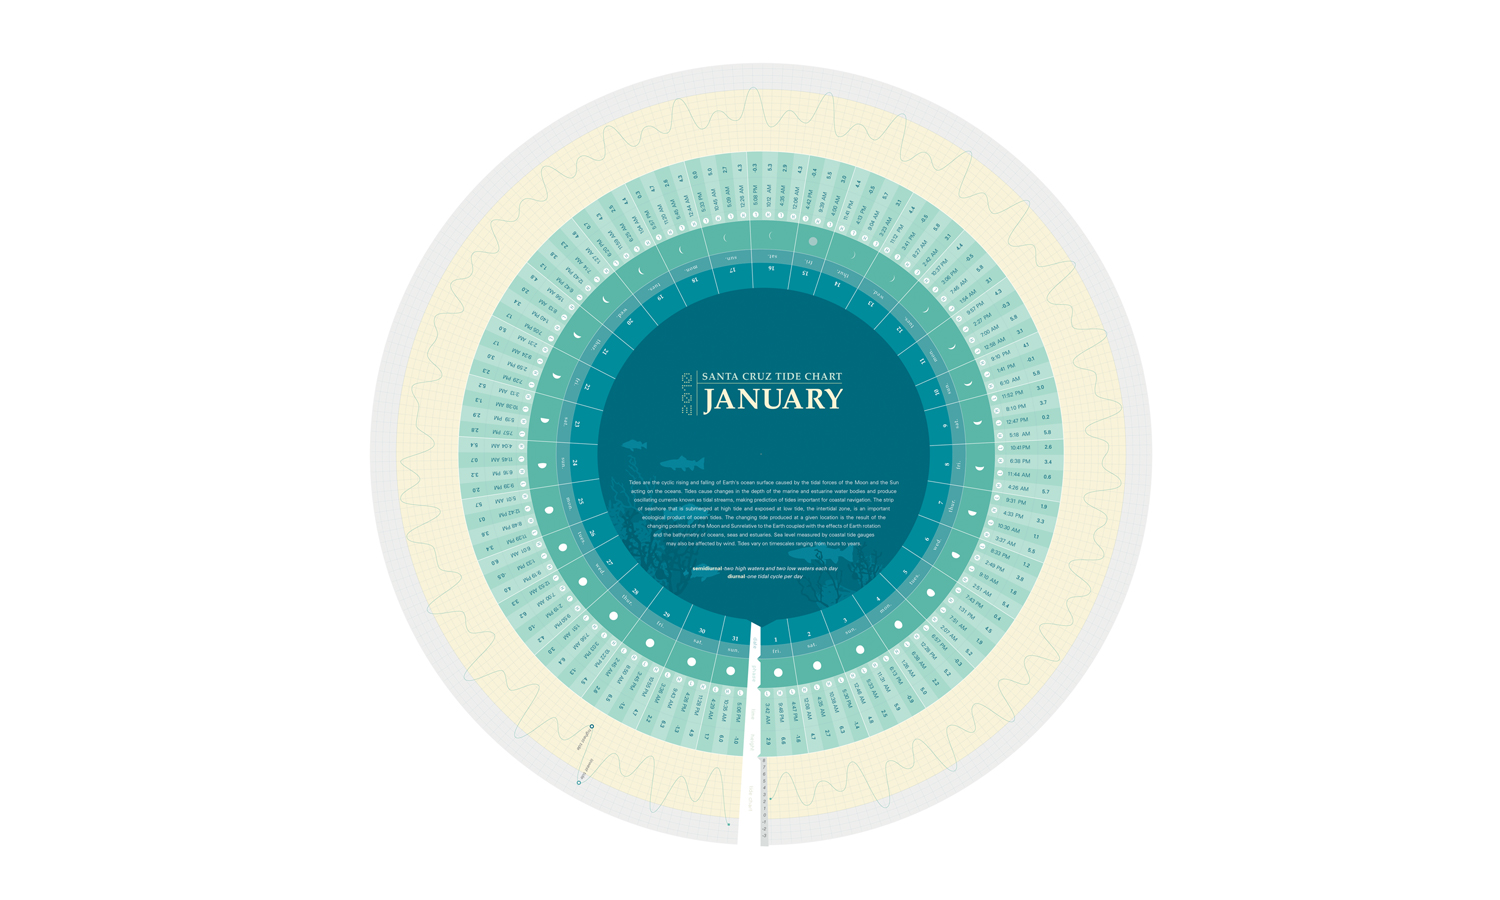
Various infographics: (Top 1–4) Infographic/tide chart for Santa Cruz low and high tides, and moon phases. Problem was current tide data had no clear hierarchy. Goal was to make data heavy information easy to read, clear structure, conceptual, and aesthetically pleasing to viewers. Circular format is used to reinforce the idea how the moon can affect tides; (Middle 5-7) Infographics for Unison; (8–9) Infographics for Genentech presentation deck; (Bottom 10–14) Infographics for Segment CDP Week. Creative Director: Angela Haddad.
